Getting Started
Framer Components
Your Dashboard
The Dashboard is your central hub for tracking performance, managing components, and viewing activity across your Supaframe account.
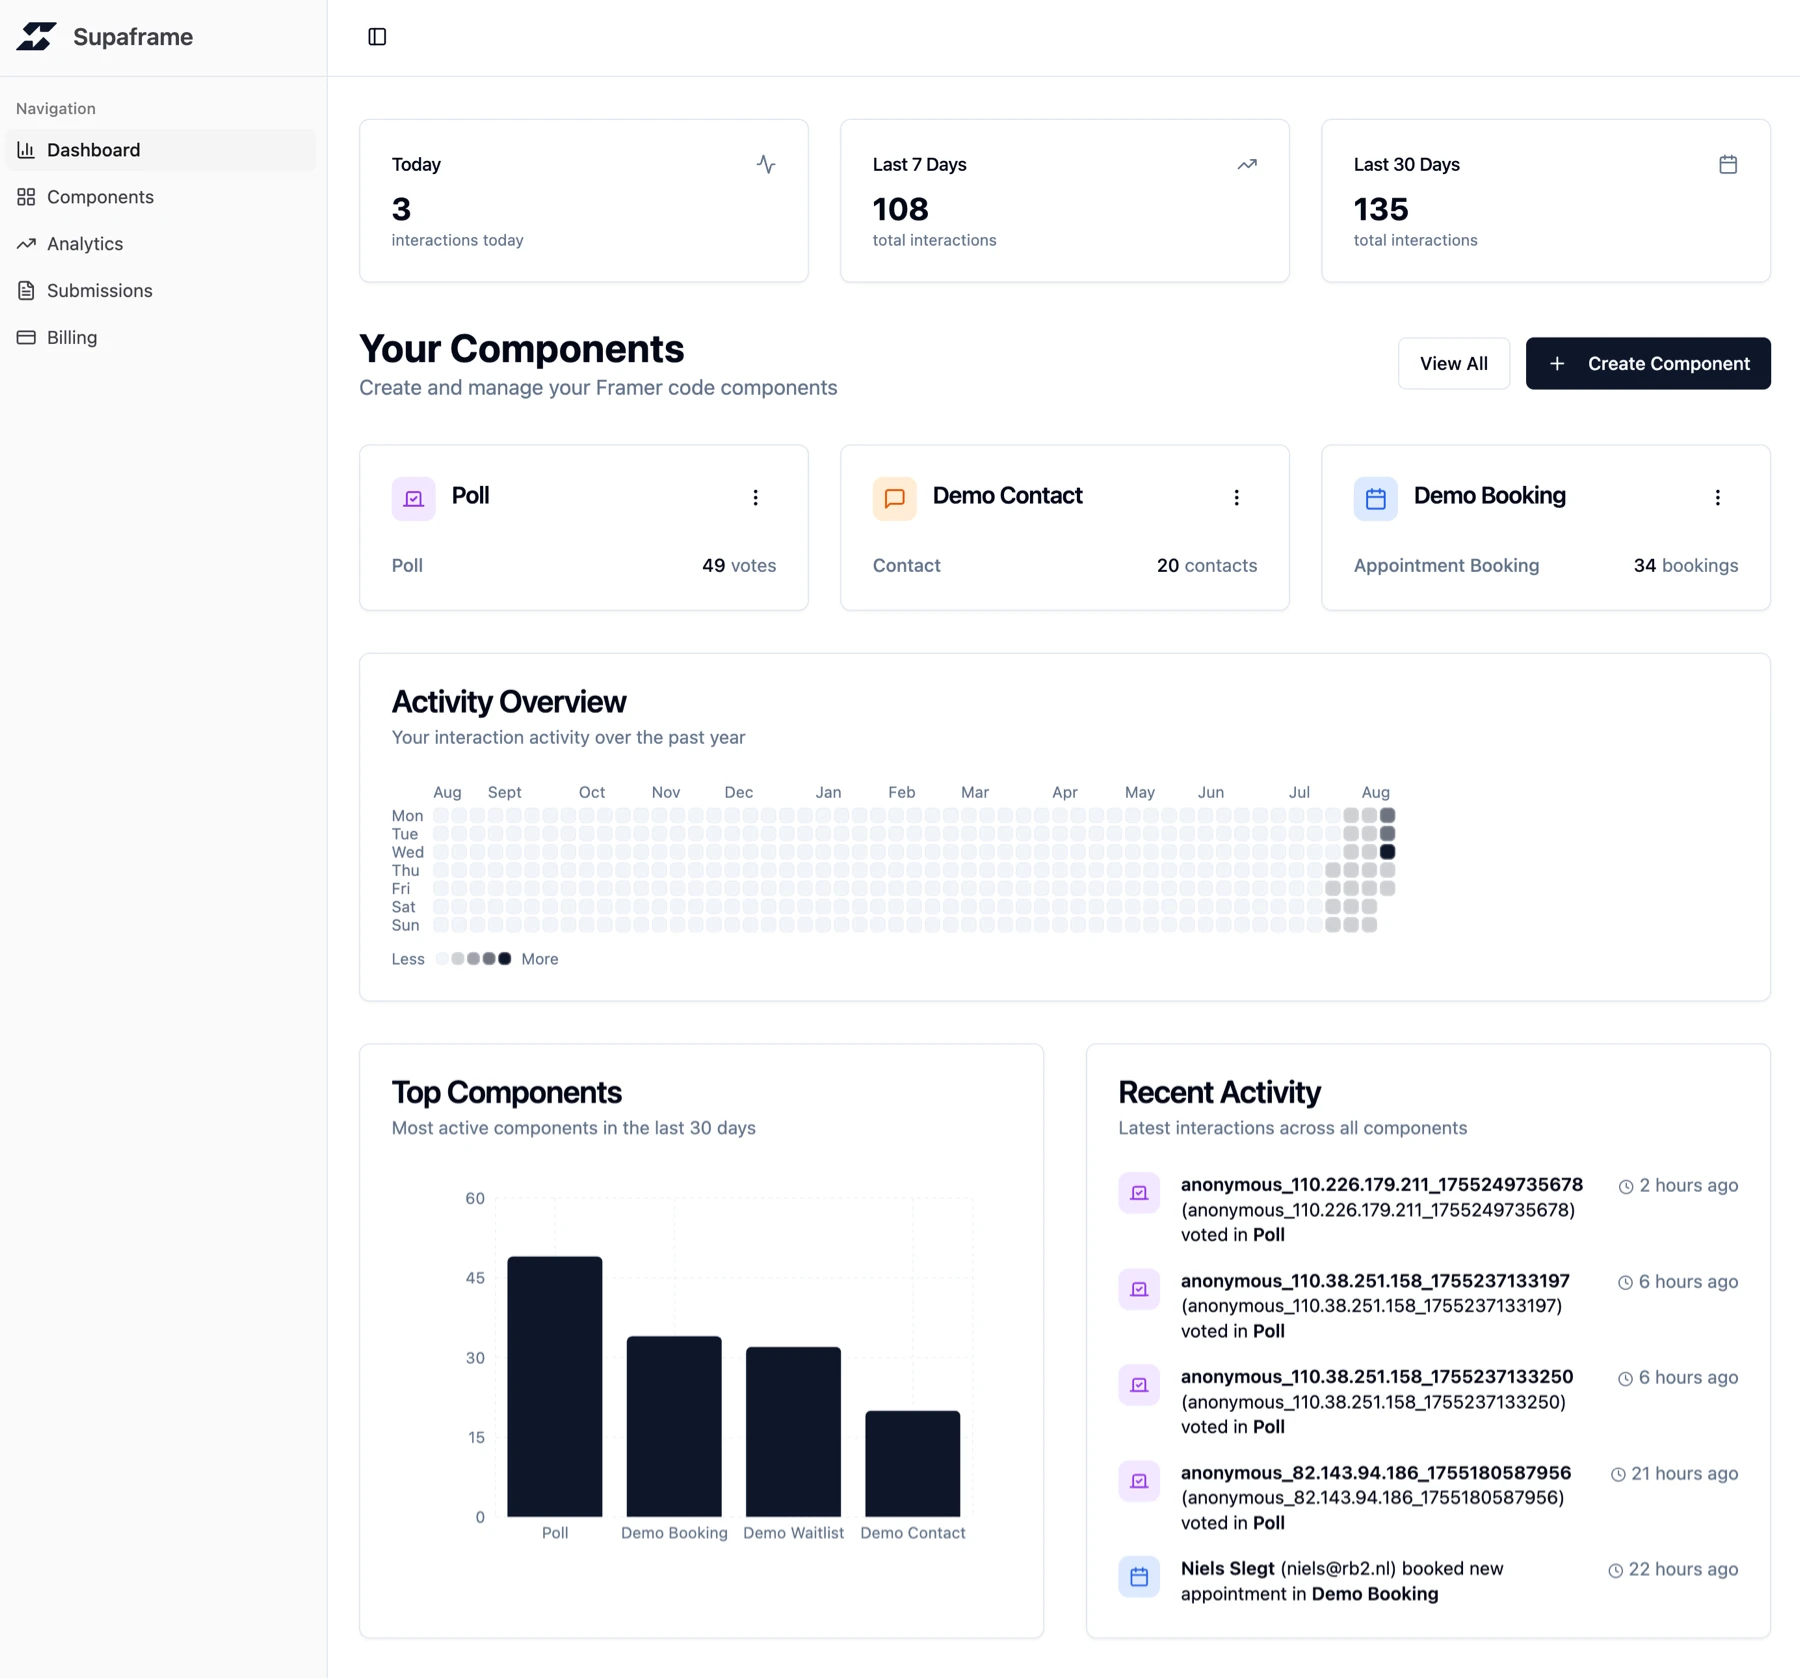
Statistics Overview
At the top of your dashboard, you’ll see daily, weekly, and monthly stats showing how many total submissions your components have received.
Recent Components
View your 3 most recent components directly from the dashboard.
Click View All to go to the Components page and see your entire list.

Create New Component
Click the Create Component button to open the creation window in a new tab and start building a new component instantly.

Activity Overview
See a year-round graph of interactions and submissions across all components. This lets you quickly spot trends and identify your busiest days.
Top Components
This section highlights your most active components so you know where your audience is engaging the most.
Recent Activity
Shows your most recent incoming submissions and new customers across all components, so you can respond quickly.
Analytics Page
For a deeper dive, the Analytics page lets you view interactions by week, month, or year — broken down across all your components.

Submissions Page
See every submission from every component in one place.
Pro Plan only: Export all submissions at once with a single click as a .CSV file.
